In my last project, I led the team that setup the Continuous Delivery infrastructure for the product marketing and publishing platform of a major consumer electronics giant. This platform was based on Scala and the Play framework and used a non-blocking architecture to achieve scale.
In this post, I want to share some of the key highlights of this project from a Devops and Continuous Delivery point of view.
Build Pipelines
We have a fully automated Continuous Delivery system setup using Thoughtworks Go and Chef Server.
- We have CD pipelines for both the application as well as the Chef cookbooks.
- Check-ins to the git repository are detected by the Go Server and automatically trigger the corresponding build pipeline for each component.
- Each build pipeline will compile, test and create a RPM artifact.
- Each component build pipeline run, once successful, will trigger the Automation test pipeline that will test all the components integrated together end to end. This uses the "fan-in" support provided by Go.
- An important aspect that allows us to have parallel, independent component build pipelines is having separate git repositories for each component.
- Automated acceptance testing for the integrated application is done on a production-like mini-environment setup using Linux Containers (LXCs) running on a Go Agent.
Testing Chef cookbooks and Infrastructure
- The Chef Cookbooks build pipeline runs a cookbook commit through a series of checks like,
- Foodcritic
- a very useful lint tool for cookbooks
- we fail the build if any correctness errors are found.
- has been really useful in catching a range of issues quite early in the build pipeline.
- Ruby syntax checks
- Rspec unit tests for helper modules
- Integration tests
- Foodcritic
- The build fails if any of the above stages fail.
Docker
- Integration testing of chef cookbooks is done by spawning Docker containers using Test Kitchen and the Kitchen Docker plugin. For now we only test for chef convergence. It's also possible to add specific integration tests that can verify the provisioned container.
- Using Docker for Chef cookbook integration testing is a great win because it allows us to run the full cookbook each time on a fresh instance for every commit. The container's fast boot up time makes this a snap.
- Docker also allows us to have a base docker container image setup with the required dependencies like Chef client, ruby, Chef Zero server etc., so that each test run doesn't need to download and install all these dependencies, thus leading to a much faster feedback cycle.
- Test Kitchen also has support for provisioning multiple docker containers in parallel.
- The best part of this setup is how a mock chef server is spawned locally using Chef Zero by Test Kitchen and the cookbooks are uploaded to this fast in-memory Chef server.
- The chef client runs are then automatically configured against this Chef Zero server. This allows us to test our cookbooks before uploading to the actual Chef Server, ensuring that only those cookbooks which pass the tests are actually uploaded.
- You can't launch a VM from within a already virtualized environment. So spawning a VM to test our cookbooks from a virtualized build agent is not possible. And that's why something like Docker is such a great boon because you can launch as many containers as required from within a VM.
Rspec
-
In addition to the above, we have Rspec tests to test a newly provisioned environment is correctly setup. These ssh into the newly provisioned environment and run a series of low level tests like,
- are the ports setup correctly,
- are the servers configured with the right roles,
- are the required number of servers provisioned,
- is the network access in place,
- is the application running under the right user and group
-
We have found it far easier to run these tests to identify issues than to manually test each possible scenario.
-
For e.g, if you are running Mongodb as Primary/Secondary configuration with reads allowed from both, and you have say 4 backend end servers talking to these 3 Mongodb servers ( 1 Primary + 2 Secondary), then you have 12 connectivity tests to perform. This can be easily done via these Rspec tests.
-
Use of Rspec was good fun because it allowed us to write custom matchers like
node["fqdn"].should be_sshableandnode["fqdn"].should be_able_to_connect_to(db['fqdn'], 27017) -
Rspec "shared examples" were a great help in allowing reuse of common test conditions.
-
Most important of all, Rspec's describe structure helped us capture and represent the high level description of the environment itself. You could just read the main rspec file for an environment to understand the different components that made up the environment and how they were structured. Then you could delve down deeper into the tests for each component and each service to understand them better.
-
E.g, the below describes a Blue/Green production setup.
describe "production" do describe "live" do describe "blue" do it_behaves_like "Component 1", env_config, nodes it_behaves_like "Component 2", env_config, nodes end describe "green" do it_behaves_like "Component 1", env_config, nodes it_behaves_like "Component 2", env_config, nodes end end end -
We later found out that a similar approach can be done by using the Serverspec framework. Though this seems a bit heavyweight for our needs and but something to check out the next time.
Local development environment for Chef cookbooks
- We developed and tested our cookbooks locally using Vagrant and Test Kitchen.
- Vagrant-cachier was a great time saver for local cookbook development. This plugin ensured that the dependencies downloaded from our RPM server are cached locally so that they are not downloaded again when we destroy and re-provision the vagrant box.
- We also used the Polipo caching proxy locally for the non-rpm artifacts that were being downloaded by our Chef scripts. These were cached locally by Polipo and so re-provisioning a vagrant box was a snap.
- This combination of Test Kitchen, Docker, Chef-Zero, Vagrant Cachier, and Polipo made local cookbook development such a pleasure.
- Something we would like to try the next time is using Berkshelf with the one git repository per cookbook pattern.
One Click Deployment Pipelines
- Deployments are triggered and orchestrated using Go deployment pipelines.
- These are one-click fully automated deployments triggered from the Go web dashboard. No need to log on to a remote terminal.
- Only builds that have successfully passed the Acceptance test pipeline are available for deployment.
- Deployments are done using Chef itself.
- We have a deployment pipeline per environment to deploy to. This allows us to track the latest build deployed to each environment.
- The deployment pipelines do the below in sequence,
- Deploy the RPMs by triggering a chef client run on the target nodes
- Upload the test data required to setup the environment.
- Check the correct versions have been deployed by querying the "/version" http endpoints.
- Run a few sanity tests to check the application deployment went through fine and that the application is up and running.
Promoting builds across environments using deployment pipelines
- Since we deploy a build to the UAT environment only after QA has been done on the QA environment, the Go deployment pipelines models this process.
- This is done by making the UAT deployment pipeline downstream of the QA deployment pipeline.
- We can then promote builds from QA to UAT using Go's Fetch Artifact task.
- The QA deployment pipeline has a sign-off stage which is manually triggered once the QAs are happy with a build.
- Only the builds which have passed the sign-off stage of the QA deployment pipeline are available for deployment to the UAT environment.
- Similarly Production is downstream of the Staging environment.
- It's not advisable to make the pipeline dependencies too sequential. This can reduce the flexibility required sometimes when you want to directly deploy say to the Staging environment to quickly check a Production bug fix. But something like deploying directly to the Production environment is best avoided and so a pipeline dependency mandating a deploy on Staging first makes good sense.
Traceability
- We can trace the flow of each and every commit through these series of build and deployment pipelines.
- A given deployment on any environment can be traced back to deployments on upstream environments, all the way back to the actual commit.
- This complete traceability is visible to anyone with access to Go and so everyone from our developers and QAs to our stakeholders has complete visibility to the development timeline.
- We use pipeline labels to make this traceability more visible.
- E.g, you can see below exactly which version of Inventory and Catalog passed the Acceptance and was promoted to Production and which commits these versions map to.
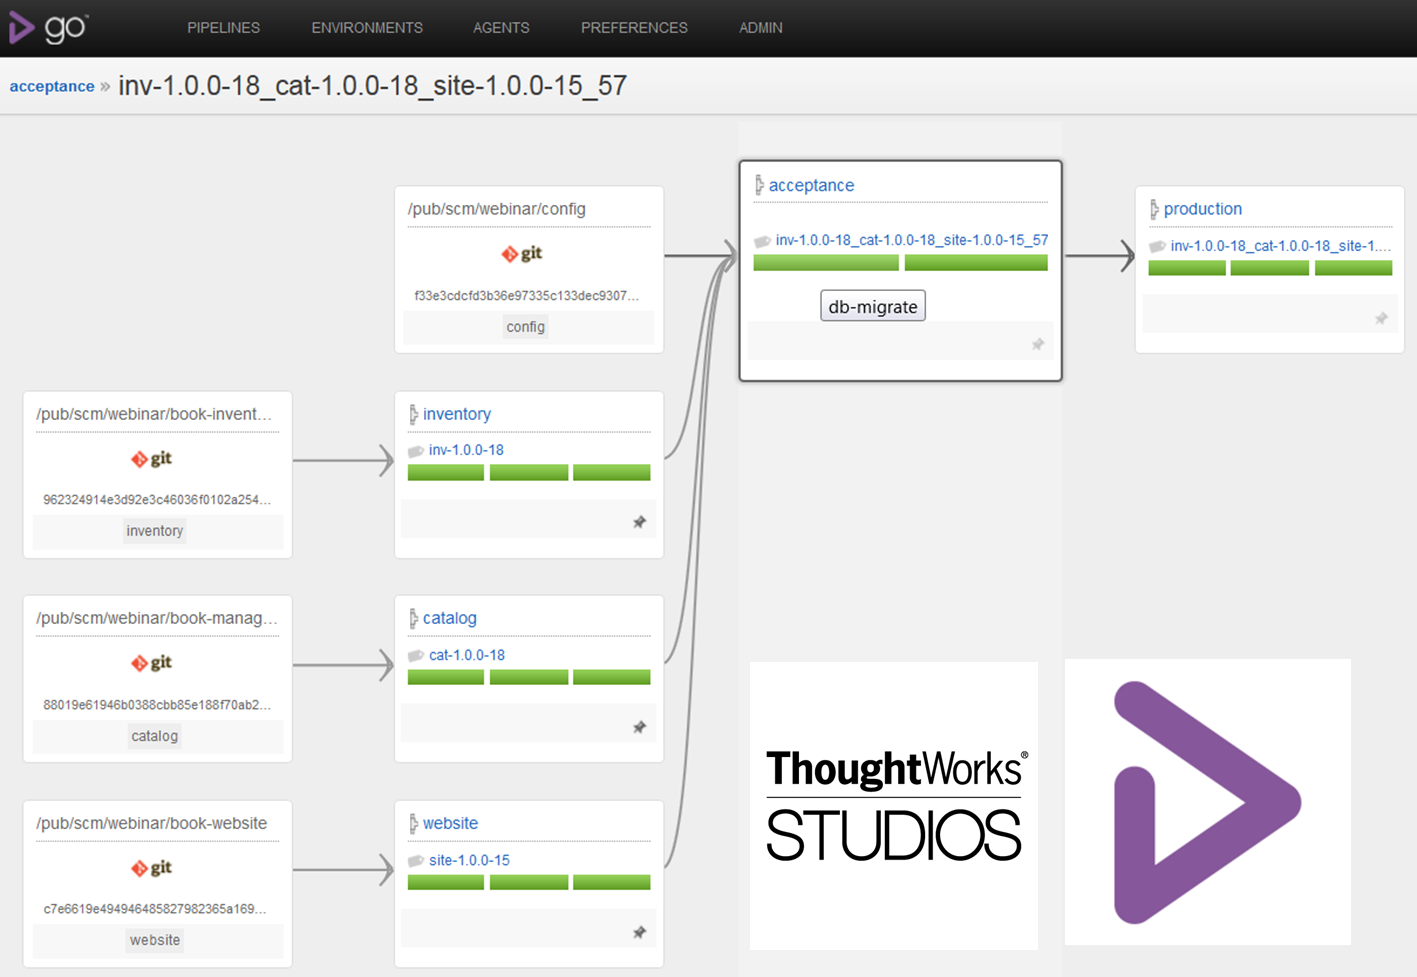
Read here for more, How do I do CD with Go?: Part 3: Traceability with upstream pipeline labeling
RPMs
-
The build produces application artifacts packaged as RPMs which are uploaded to a local RPM server.
-
This makes application deployments as simple as a regular RPM install and so can be done by Chef itself. No need for another tool to do deploys.
-
The specific application version to be deployed is set using Chef Environment attributes.
-
Using RPMs for deployments allows us to leverage the built-in package management features of yum. This is a great win and greatly simplifies application deployment and management.
-
For e.g, finding out the application package installed on a server is just a simple yum command away.
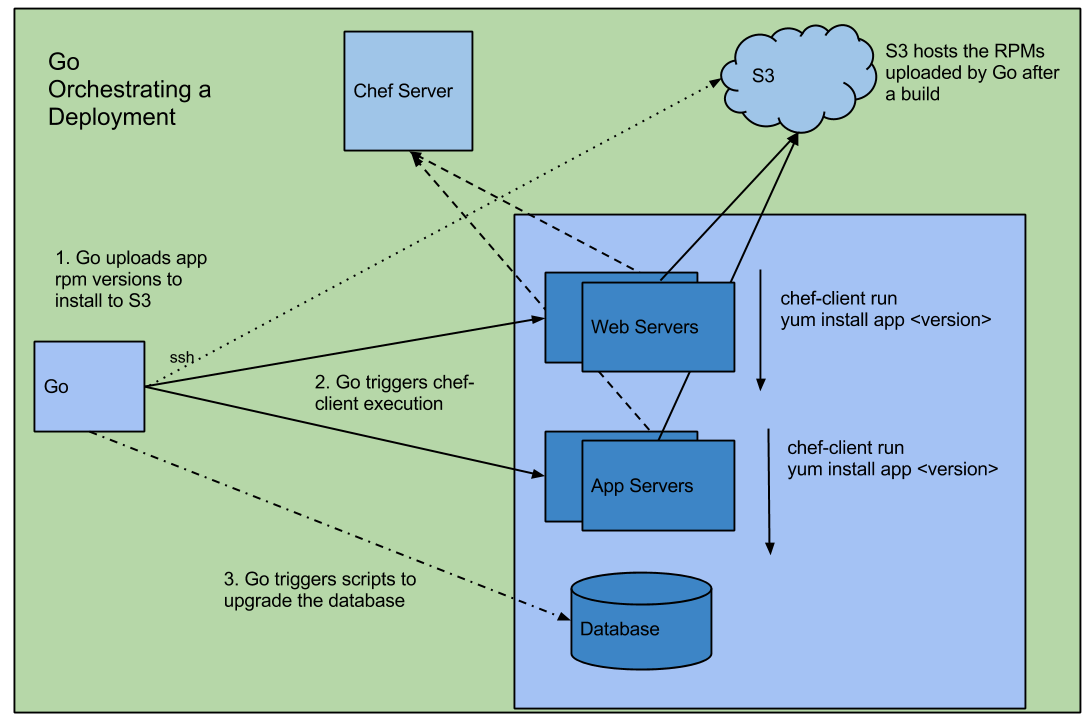
-
In a nutshell, Go orchestrates the deployment using Chef Server and a RPM mirror (hosted on S3)
Blue/Green Deployments
- Production deployments follow the Blue/Green model with both stacks actively serving live traffic.
- The Go deployment pipeline for the Blue/Green deployment first brings the Blue stack down to standby, effectively taking it off the load balancer, deploys to the blue stack, waits for manual sanity testing sign-off and then after bringing it back live, does the same for the Green stack.
- My colleague, Sunit Parekh has written about this in more depth here.
Performance Testing
- We have a Go pipeline to trigger nightly performance test runs. The test results are uploaded and available on the Go Server.
- We use Gatling for scripting our performance tests. Scripting these tests in code is a pleasure and allows great code reuse and modularity compared to working with GUI driven testing tools.
Environment Provisioning
- Because we had automated the setup and provisioning of the entire environment in Chef, it was very easy for us to meet our client's demands for a new environment to be setup if required.
- This came in handy when we had to move our setup from Amazon EC2 to the client's data center.
Monitoring
Ganglia + Nagios
- Monitoring is done through Ganglia with Nagios alerting based off Ganglia metrics itself.
- This avoids installing nagios on each node and the unnecessary redundant collection of monitoring data and allows us to use both tools to their strengths.
- Ganglia gives us trending data and Nagios allows us to configure alert thresholds on this data.
- One great advantage of Ganglia is the cluster support and how it shows an aggregate view of the metrics at a cluster level.
- We capture both application metrics as well as system metrics.
- Ganglia has good support for many of the different applications like Nginx, Mongodb etc...
- We used the Codahale Metrics library to push custom application metrics to Ganglia.
- We also use the built in Codahale support for JVM metrics to chart the heap and thread usage. This is of great help during performance testing.
- Deployments are tracked as events overlaid on Ganglia graphs. This helps us correlate spikes in graphs to a corresponding deployment.
- Ganglia is a great tool, but setting it up in Unicast configuration on Amazon EC2 with multiple clusters and grids was quite a challenge. I now see more blog posts describing this setup appear online, but back then we were on our own and this took us much trial and error.
Logging
- We have centralized Log aggregation through Splunk. Splunk is a great tool and allows us things like
- Great search capabilities.
- Email alerting on critical issues found in the logs.
- Regular email reports summaries.
Summary
Implementing CD for this project was quite satisfying. Go's rich support for pipelines and pipeline dependencies was greatly instrumental in helping us closely model the actual development and deployment process being used in the project. The dashboard gave complete visibility to everyone. And the one-click deployments meant that even non-developers could trigger deployments.
There were lots of learnings in implementing all of this. And I hope to share more of these with you over a series of upcoming blog posts.